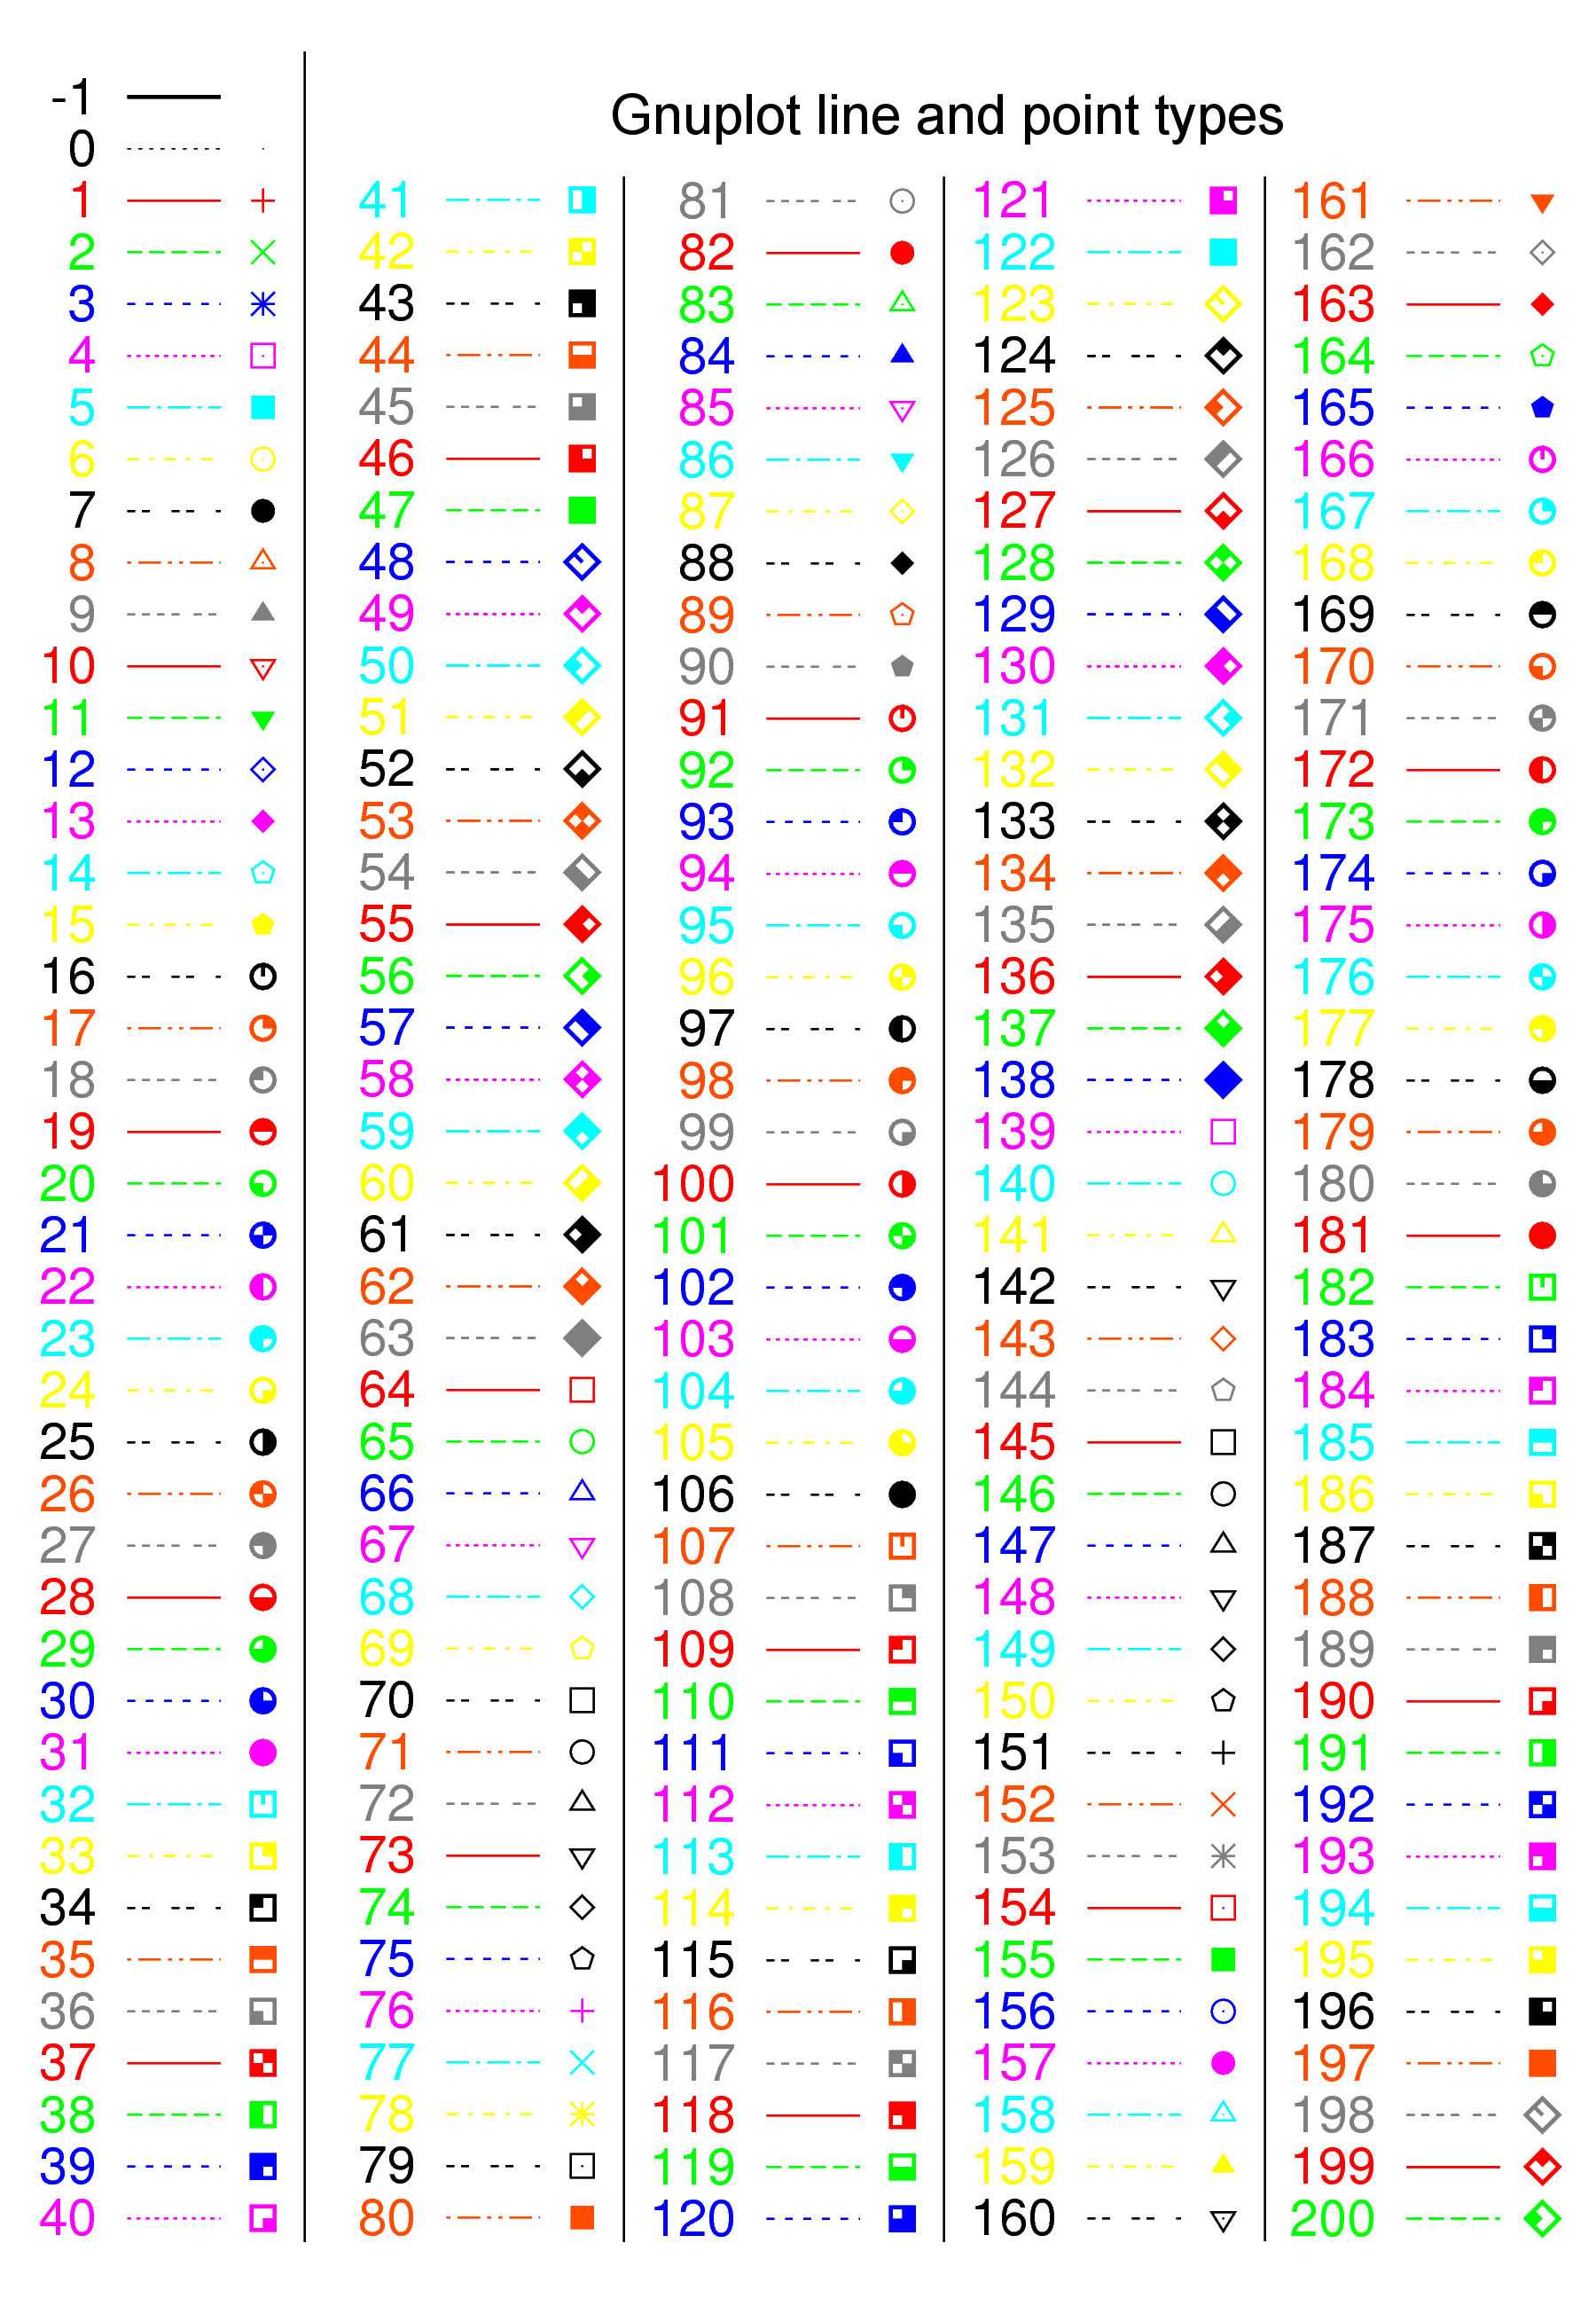
Gnuplot
Line Type, Point Type
Example1
#!/usr/local/bin/gnuplot

set terminal png
set output "out.png"
set title "Title"
set xlabel "Packet Size [Mbps]"
set ylabel "Y Axis"
set xrange [0:1200]
set yrange [0:11000]
set xtics (64, 128, 256, 512, 1024)

plot \
	"data.dat" using 1:2 with lines title "legend 1:2", \
	"data.dat" using 1:3 with lines title "legend 1:3", \
	"data.dat" using 1:4 with lines title "legend 1:4", \
	"data.dat" using 1:5 with lines title "legend 1:4", \
	"data.dat" using 1:6 with lines title "10GbE wirerate", \
#  pktsize  vanilla  vanilla   vanilla  susanow  susanow  susanow  10GbE
#           DPDK 1T  DPDK 2T   DPDK 4T  ssn 1T   ssn 2T   ssn 2T   Wire
#           D=100    D=100     D=100    D=100    D=100    D=100    Speed
#   1       2        3         4        5        5        5        6
    64      3030     5800      8832     2200     4200     8200     9999
    96      4000     7800      9200     0000     0000     0000     9999
    128     5324     9998      9998     0000     0000     0000     9999
    256     9902     9998      9998     0000     0000     0000     9999
    512     9998     9998      9998     0000     0000     0000     9999
    1024    9998     9998      9998     0000     0000     0000     9999
Example2
#   n_core  vanilla susanow 10GbE
#           DPDK    l2fwd   Wire
#           D=100   D=100   Speed
#   1       2       3       4
    1       3030    2200    9999
    2       5800    4200    9999
		4       8832    8200    9999
#!/usr/local/bin/gnuplot

set terminal png
set key right bottom
set output "out.png"
set xlabel "# Cores,Thread"
set ylabel "Throughput [Mbps]"
set xrange [0.5:4.5]
set yrange [0:11000]
set xtics 1, 1, 5


set style line 1 lt 1 lw 1 pt 0
set style line 2 lt 1 lw 1 pt 1
set style line 3 lt 2 lw 1 pt 4
set style line 4 lt 4 lw 1 pt 7

plot \
	"data.dat" using 1:2 title "vanilla DPDK l2fwd 1:2 w/ Delay" w lp linestyle 2, \
	"data.dat" using 1:3 title "susanow l2fwd w/ Delay" w lp linestyle 3, \
	"data.dat" using 1:4 title "10GbE wirerate" w lp linestyle 4